Copy Number Variation
The BCFtools package implements two methods (the polysomy and cnv
commands) for sensitive detection of copy number alterations, aneuploidy and
contamination.
In contrast to other methods designed for identifying copy
number variations in a single sample or in a sample composed of a mixture of
normal and tumor cells, this method is tailored for determining differences
between two cell lines, which allows to distinguish between normal and novel
copy number variation.
Installation
The polysomy command requires the GNU Scientific Library.
As described in the installation,
it must be compiled with USE_GPL=1.
If it is still not visible in the list of commands, recompile with:
make USE_GPL=1 clean all
Now typing bcftools polysomy should give you a list of available options.
Preparing input data
The polysomy command takes on input VCF with FORMAT columns annotated with
B-Allele Frequency (the BAF annotation). The cnv command in addition requires the presence of
Log R Ratio values (the LRR annotation). If the experimental data were prepared
by Illumina’s GenomeStudio, its text output can be converted to VCF using the
fcr-to-vcf script.
Please check this usage example for details
and some test data to experiment with.
Detecting aneuploidy and contamination
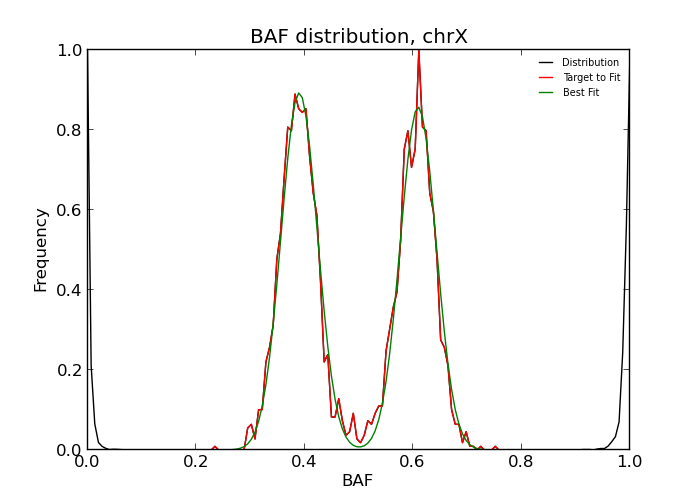
Large aberrations which affect whole chromosomes, such as aneuploidy or contamination, can be discerned directly from the overall distribution of BAF values. The command is
bcftools polysomy -v -o outdir/ file.vcf
and the results can be found in outdir/dist.dat. The file can be inspected visually or
processed by standard unix commands. For example, a list of chromosomes which are aberrant
or uncertain can be obtained by
cat outdir/dist.dat | awk '$1=="CN" && $3!=0'
If uncertain, it is very useful to inspect the BAF distribution by eye. The distribution can be plotted using the auto-generated matplotlib script
python outdir/dist.py
When the goodness-of-fit threshold -f is set too strict or when the experimental
intensities are too different from the expected distribution, the fit may fail.
This is indicated by printing -1 instead of a copy number state.
If the program outputs a non-diploid state on multiple chromosomes, this may indicate contamination or very noisy input data.
Detecting subchromosomal CNVs
The strength of the CNV caller is in the pairwise calling mode which was designed to detect differences between two samples. This greatly helps to reduce the number of false calls and also allows one to distinguish between normal and novel copy number variation. The command is
bcftools cnv -c conrol_sample -s query_sample -o outdir/ -p 0 file.vcf
The -p 0 option tells the program to automatically call matplotlib and
produce plots like the one in this example:
Working with non-Illumina data
If the fcr-to-vcf script fails from some reason or in case the input data is in a different format, the VCF file can be annotated "manually":
# Annotation file with BAF values for two samples
$ zcat baf.txt.gz | head -2
11  193096  0.24    0.16
11  193194  0.61    0.81

# Index the annotation file and fill in the BAF values. For the latter, we need to
# add a BAF definition into the VCF header
$ tabix -s1 -b2 -e2 baf.txt.gz
$ echo '##FORMAT=<ID=BAF,Number=1,Type=Float,Description="NGS estimate of BAF">' > baf.hdr
$ bcftools annotate -a baf.txt.gz -h baf.hdr -c CHROM,POS,FMT/BAF -Ob -o output.bcf input.bcf
References
Please cite our paper when using our software: (insert ref here)
Feedback
We welcome your feedback, please help us improve this page by either opening an issue on github or editing it directly and sending a pull request.

